Version v2.4.4

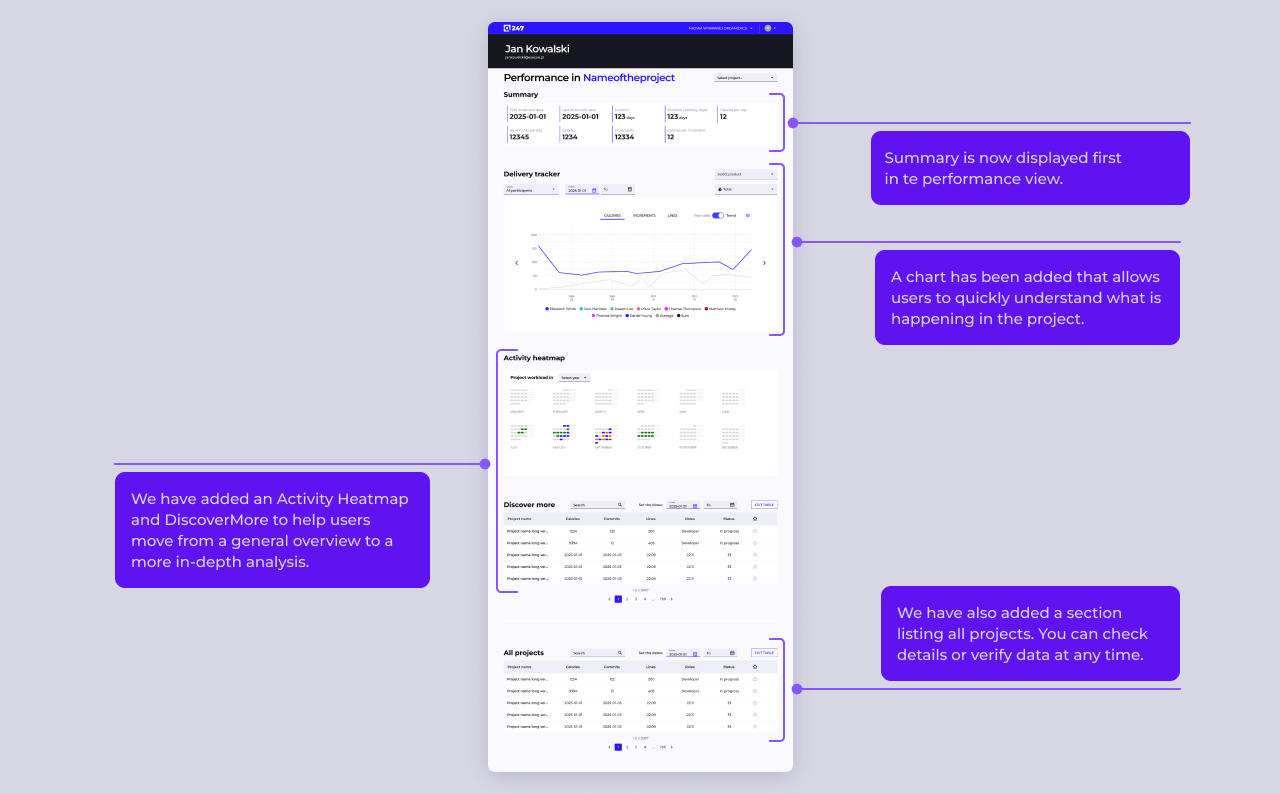
Version 2.4.4 introduces a new Workload component — a team workload heatmap on the Project and Team views that shows the distribution of each person's development effort over time and makes it easier to spot overloads and unevenly distributed work. We have also added the ability to specify which repository branches are included in the analysis, which translates into more precise metrics. The remaining improvements increase the accuracy and consistency of analytical data — including better cherry-pick detection and immediate hiding of commits across all views — and strengthen the security of access to the system.
Below you will find a detailed description of the most important changes.
New Features
Workload — Team Workload Heatmap
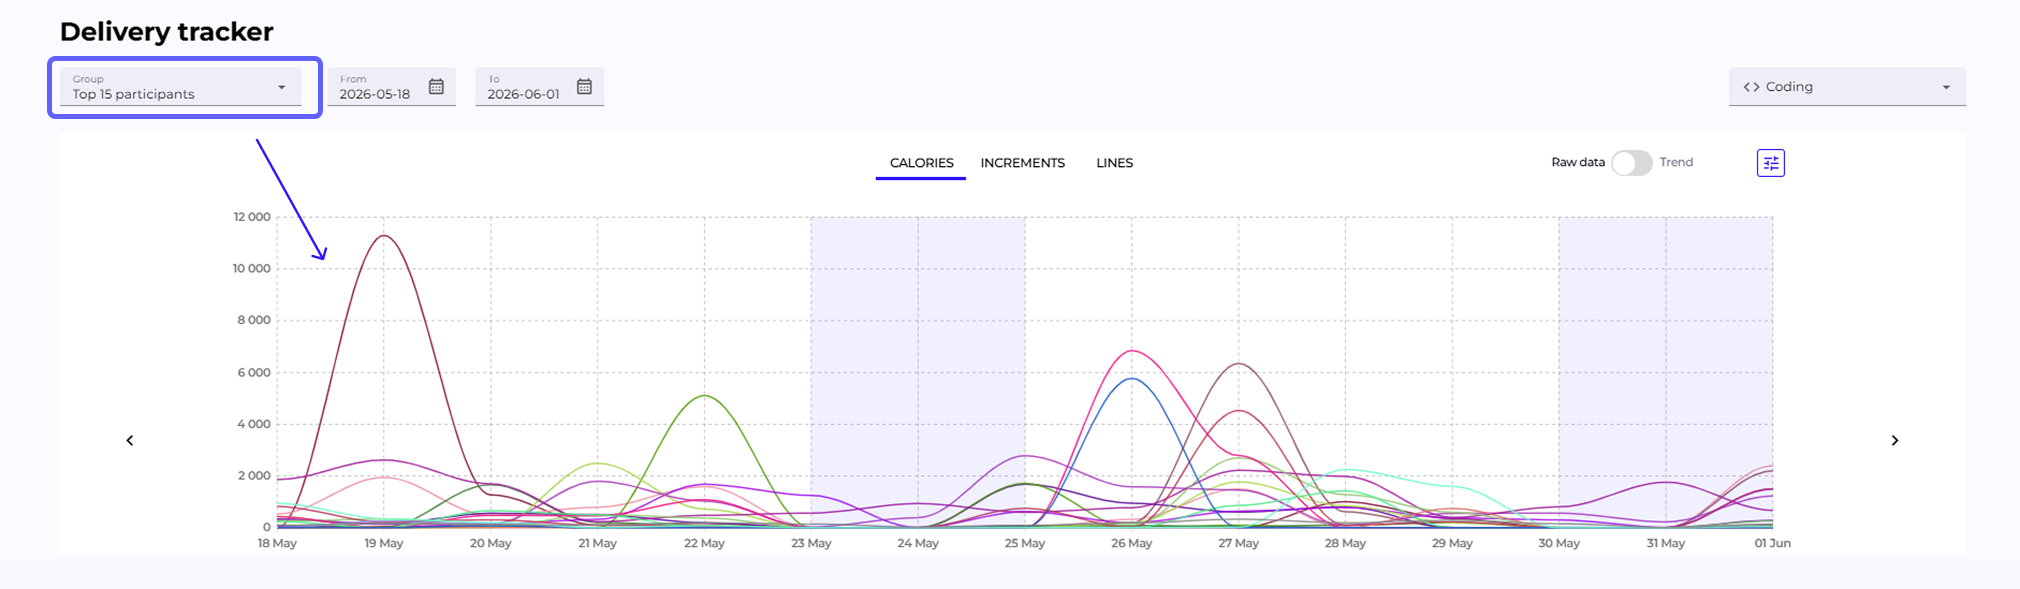
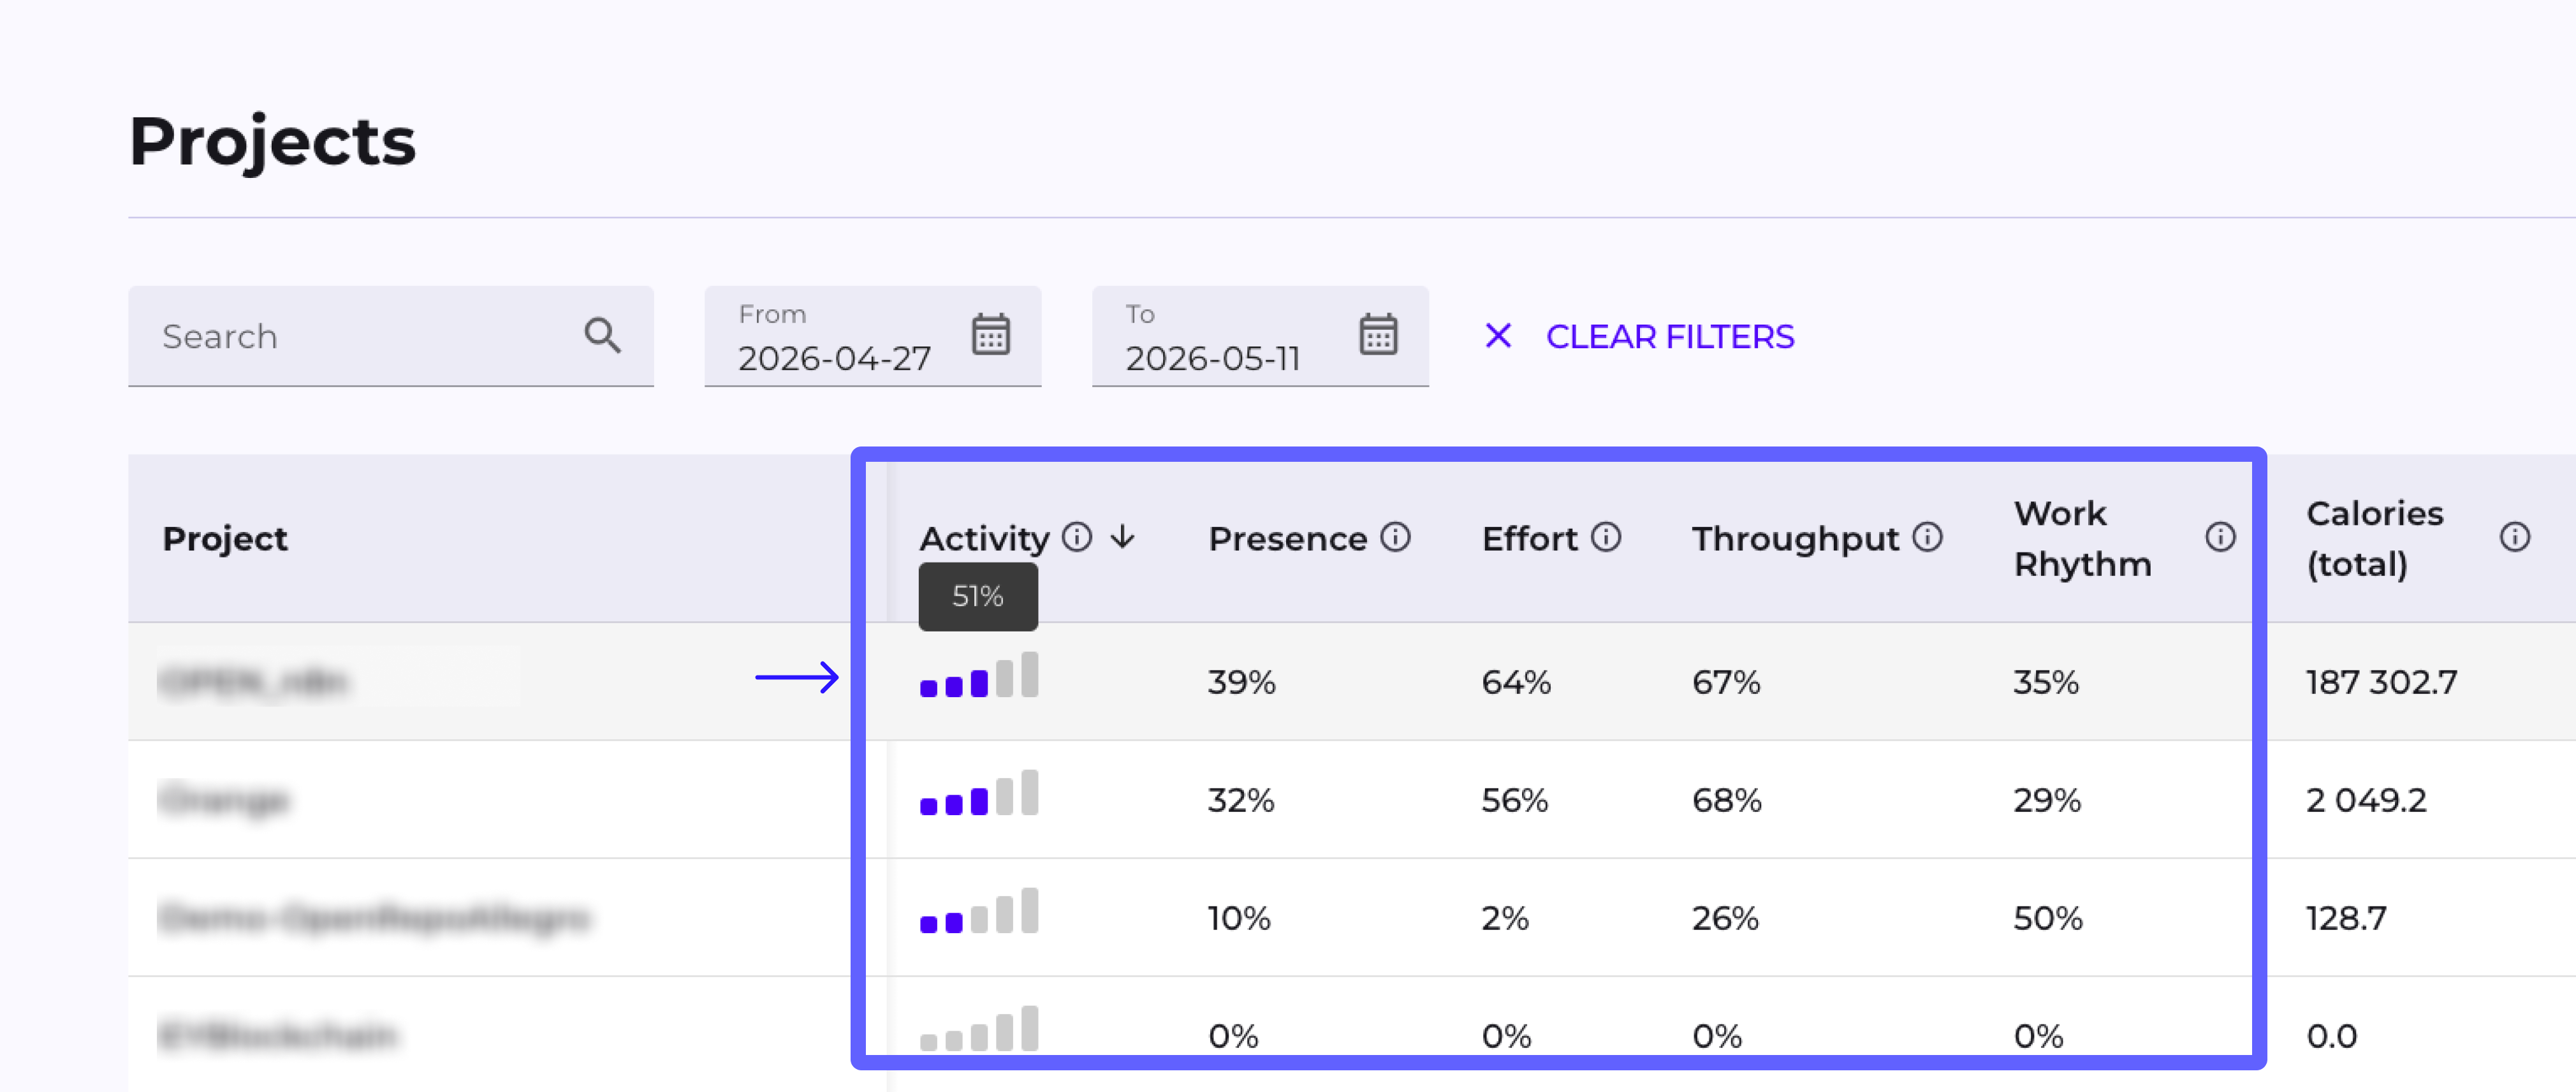
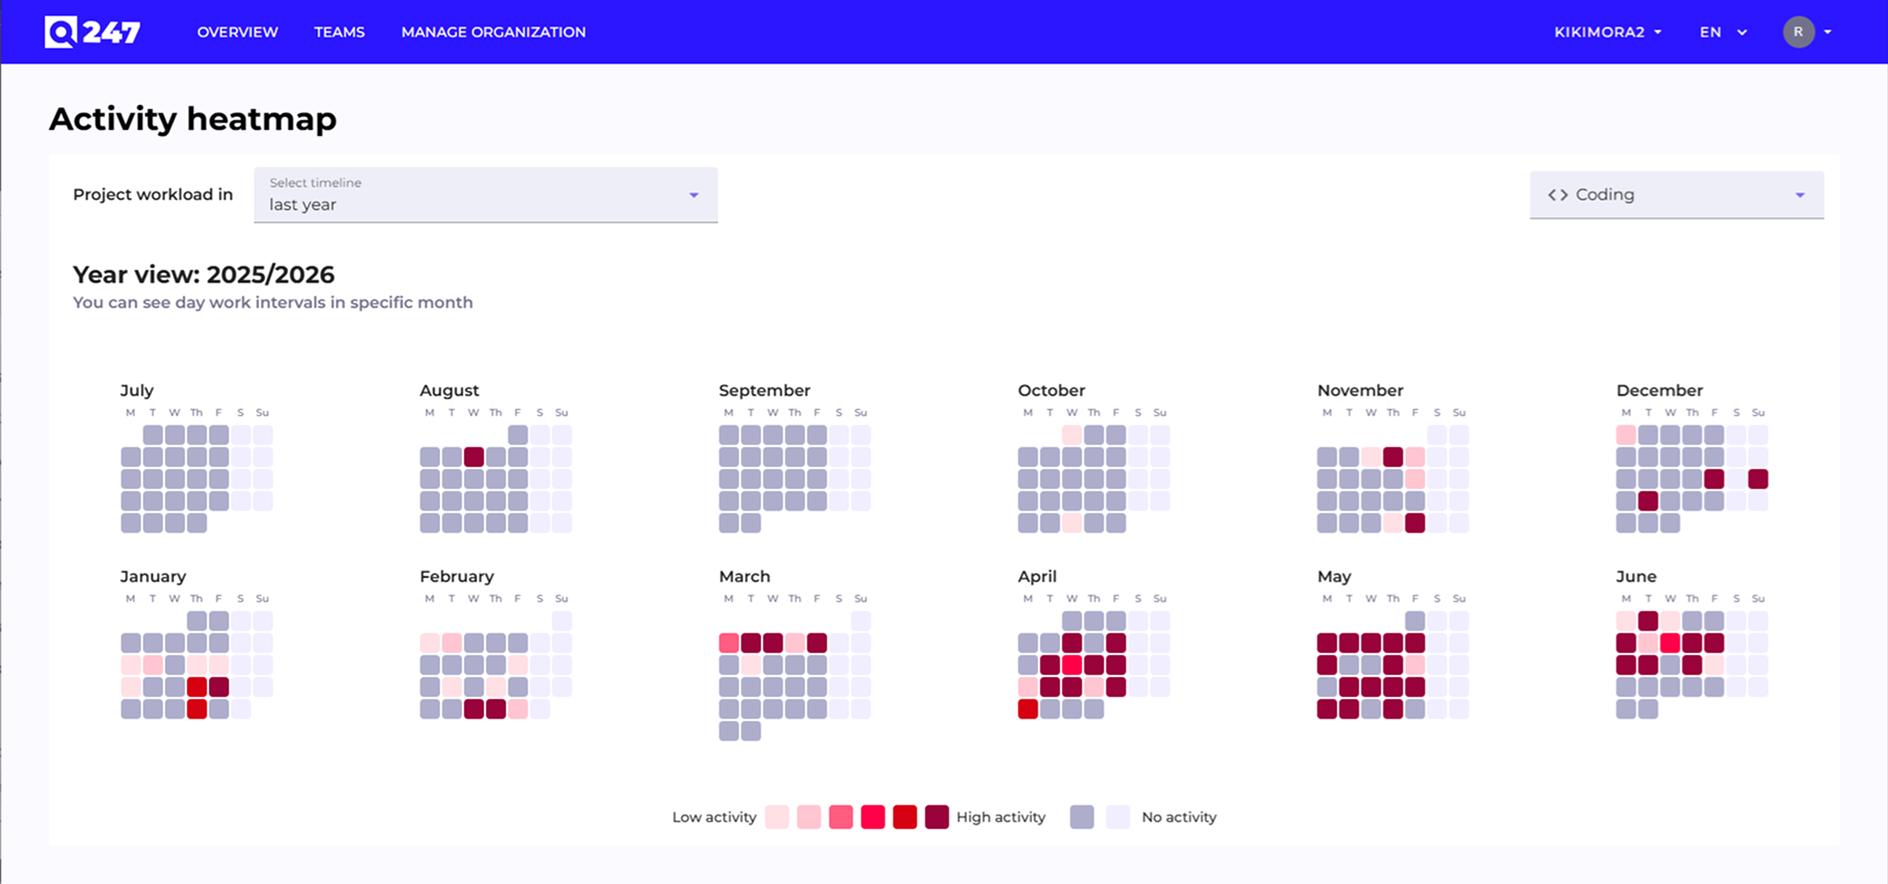
A new analytical component that, on the Project and Team views — directly below the Delivery Tracker chart — shows the distribution of each person's development effort over time. Each row corresponds to one person, each column to a consecutive period, and the intensity of a cell's color reflects the level of activity. As a result, you can see at a glance who is overloaded, where work is distributed unevenly, and how the workload changes over time.
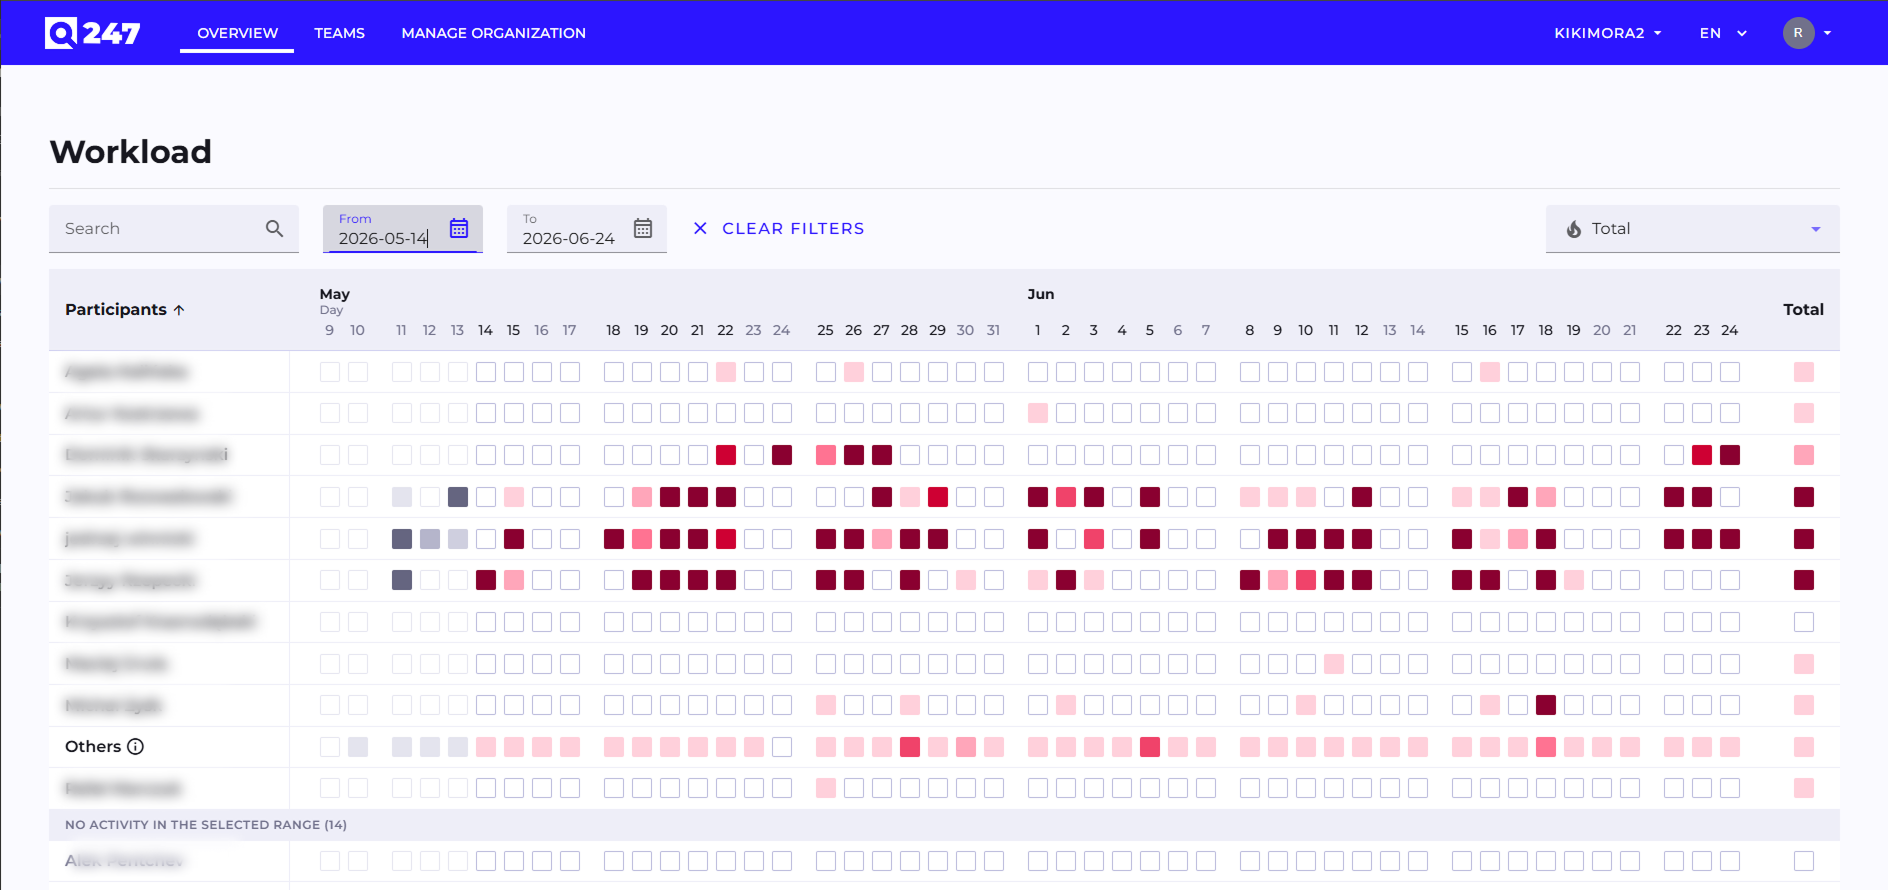
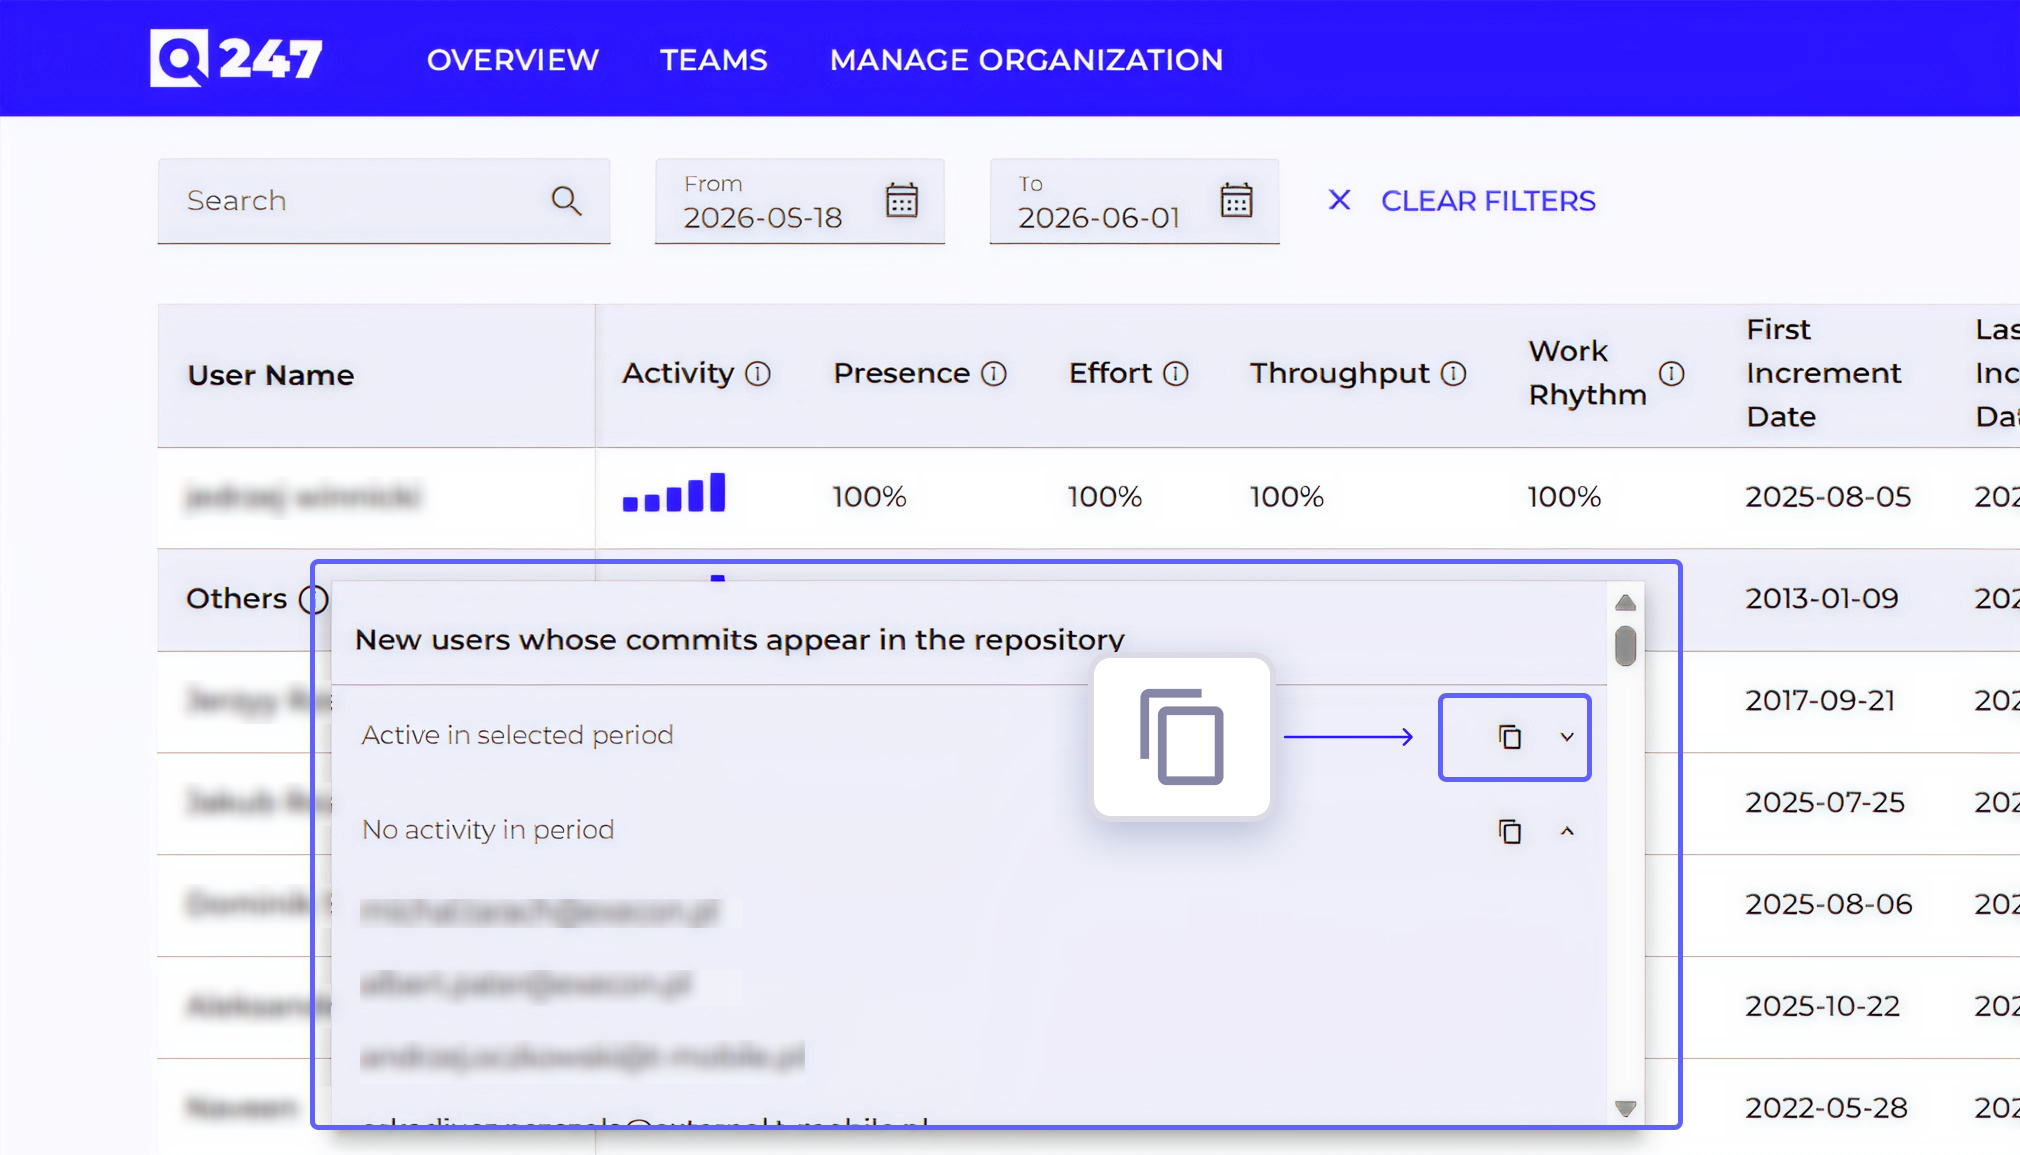
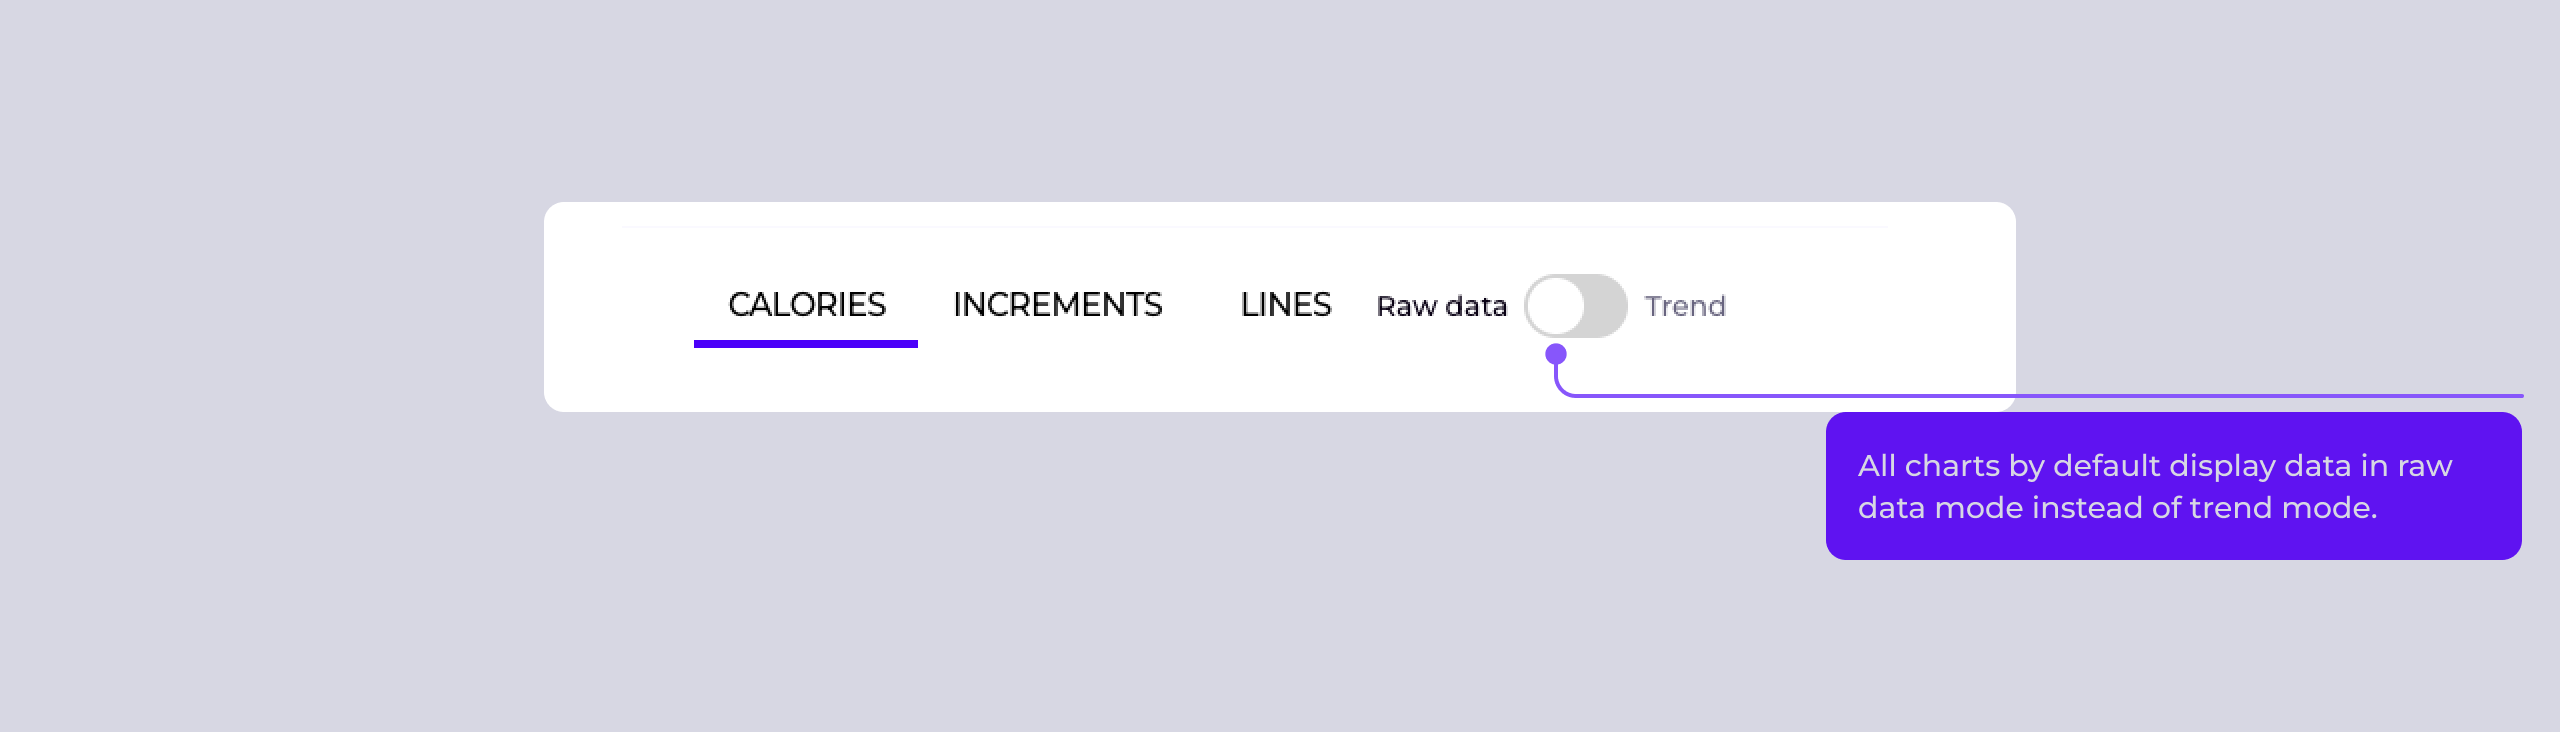
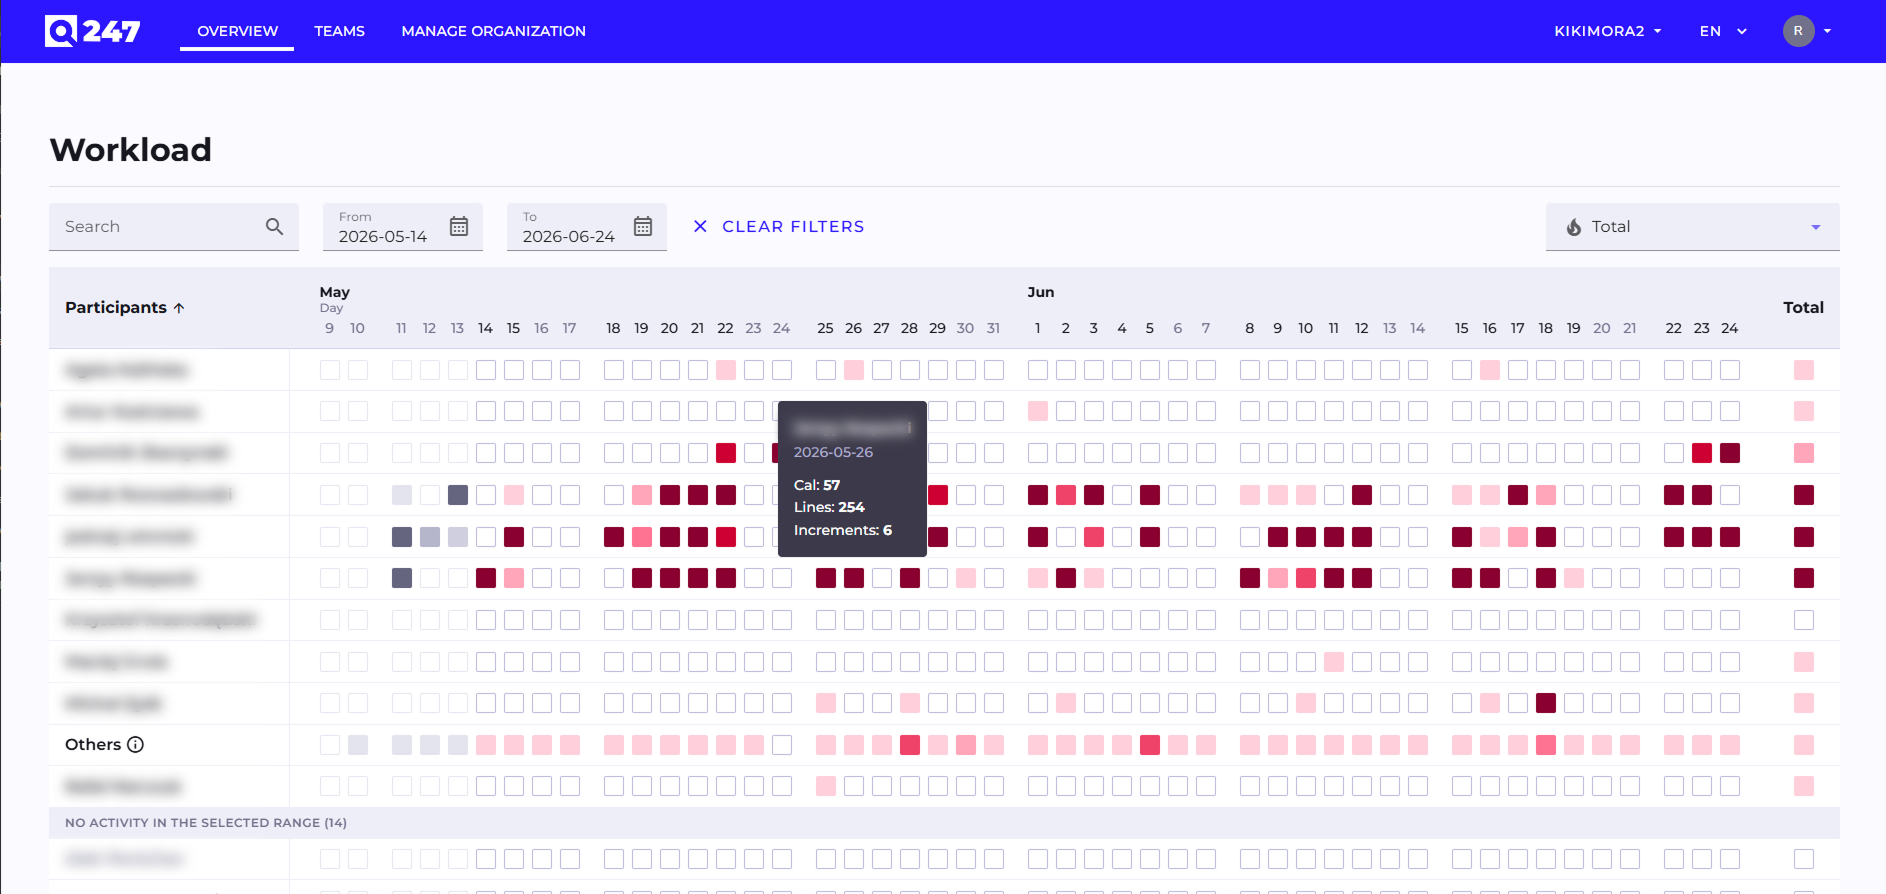
The heatmap adapts to the context: it uses the date range and metric type selected for the whole view, and the time scale automatically switches between a daily, weekly, monthly, and quarterly perspective depending on the length of the period. Hovering over a cell shows the details of that person's activity, and the built-in search and sorting (by name or activity, with active people always on top) let you quickly find the information you need. Larger teams are handled with pagination, and the footer summarizes key statistics — the number of people, business days, and the average and peak workload. The scope of visible people always matches the user's permissions.
We also took the opportunity to unify the existing activity heatmap on the Participant view — the same color scale and a richer detail preview — so that comparing workload across views is consistent.
Selecting Repository Branches Included in the Analysis (beta)
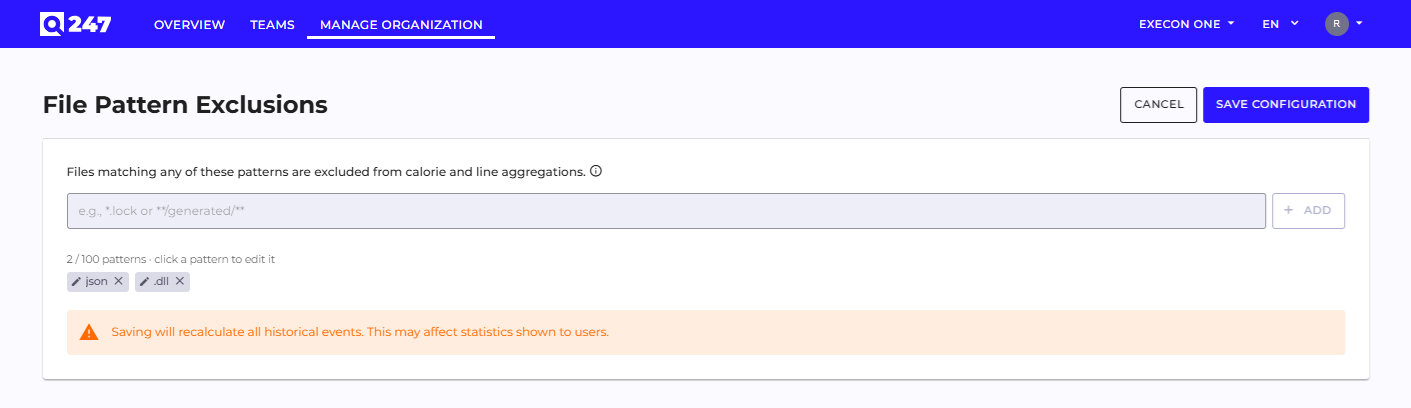
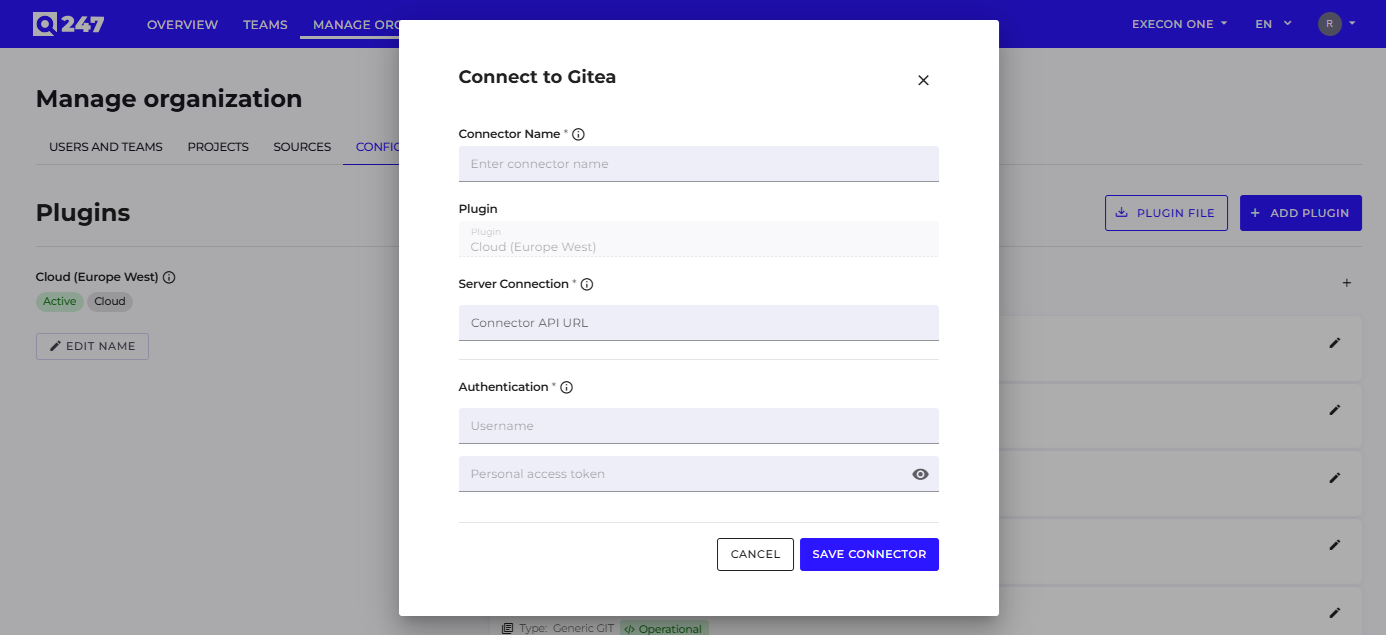
We have made available, in beta, the ability to specify which repository branches commits are counted from — globally for all repositories and individually for selected ones. This lets you skip, for example, experimental or release branches and obtain a more accurate picture of the team's work. At this stage the feature has no user interface and is enabled at an organization's request; it also requires the latest version of the Enterprise Plugin.
Improvements
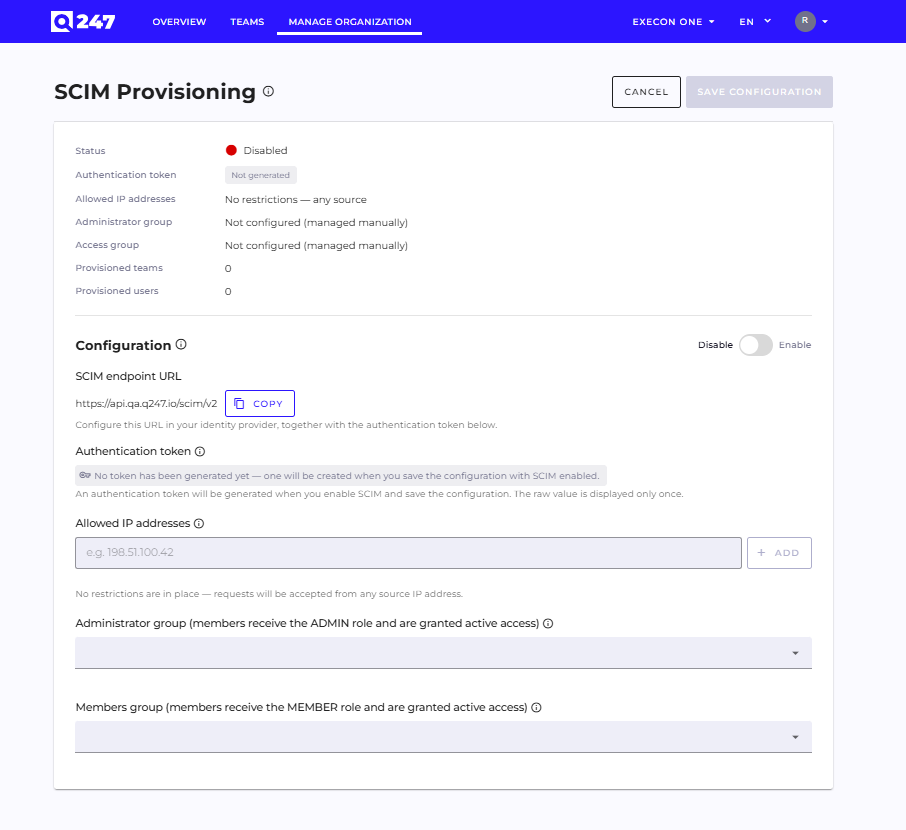
- Strengthened authentication and access-control security — a set of fixes that improve the security of login, tokens, and granting permissions in the system.
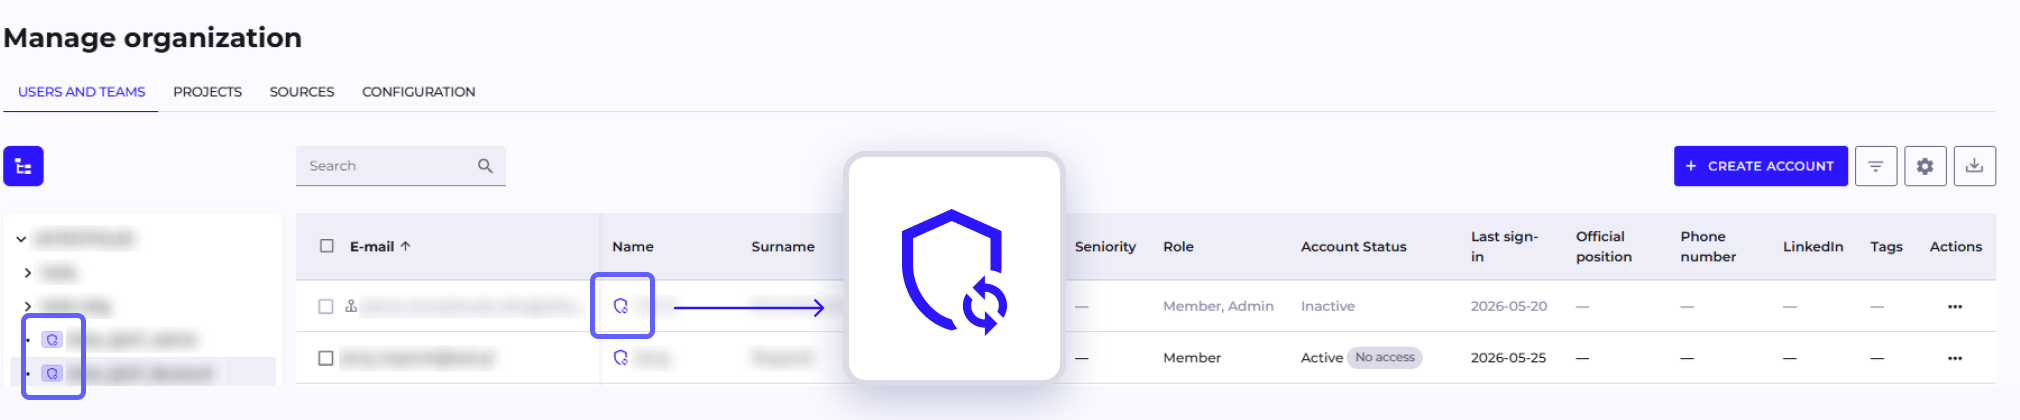
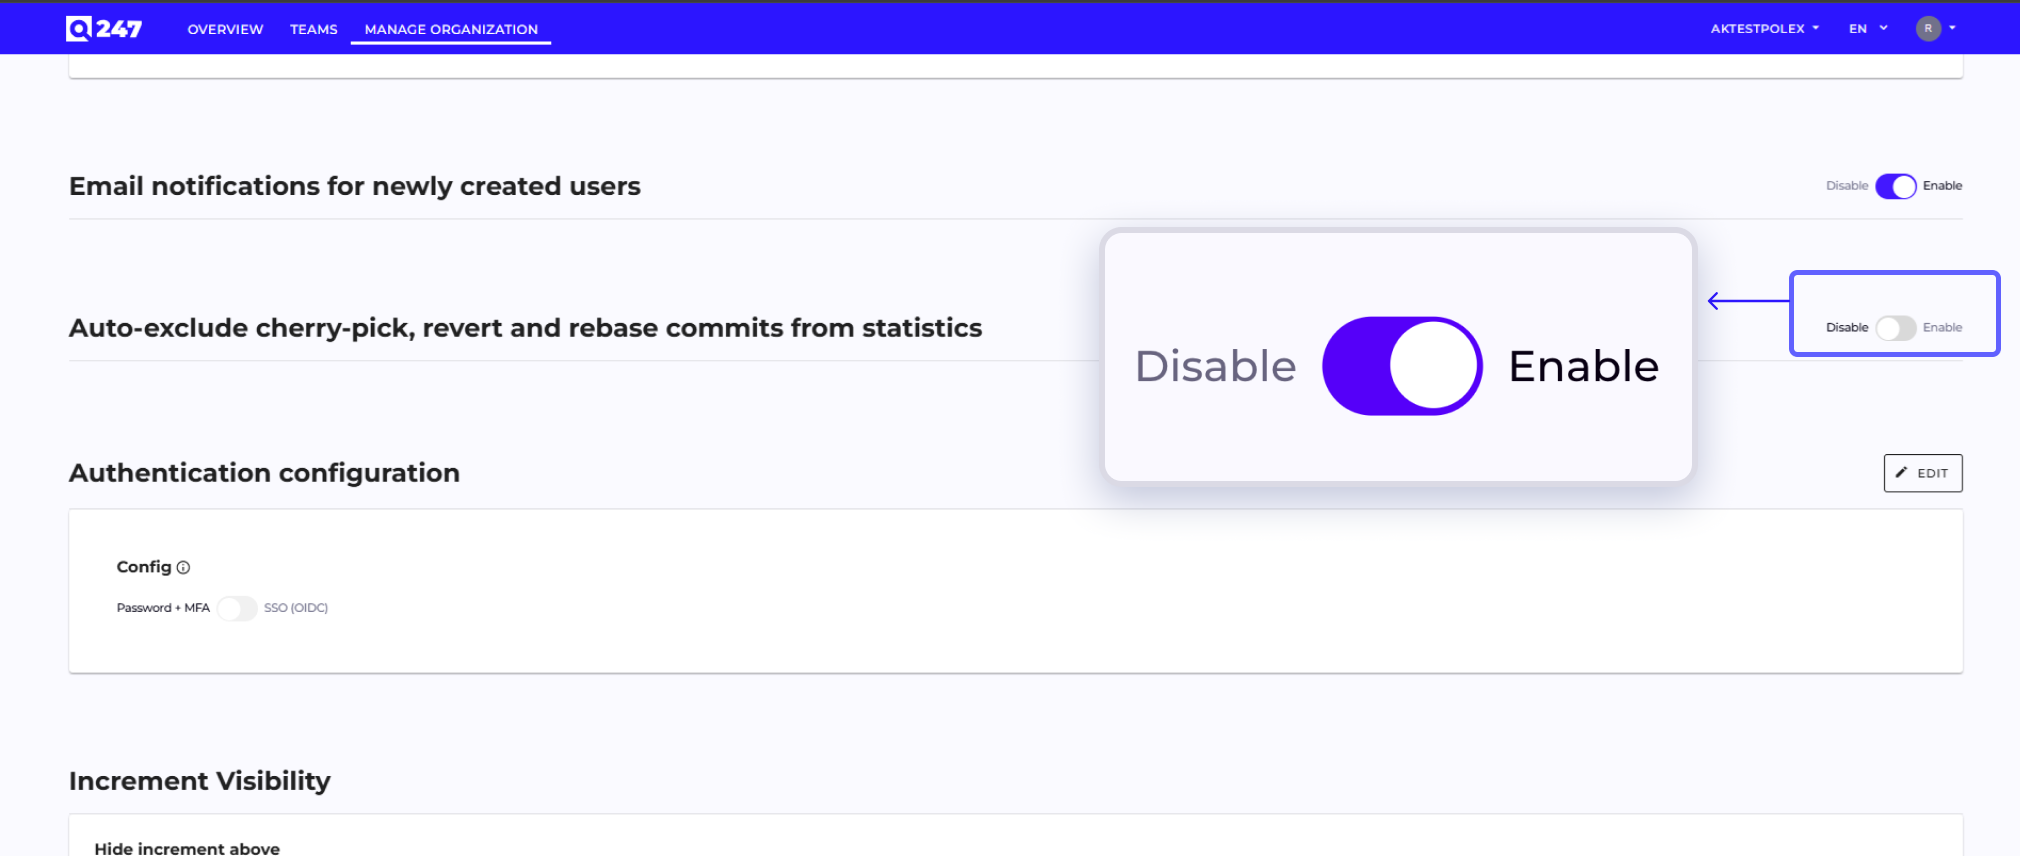
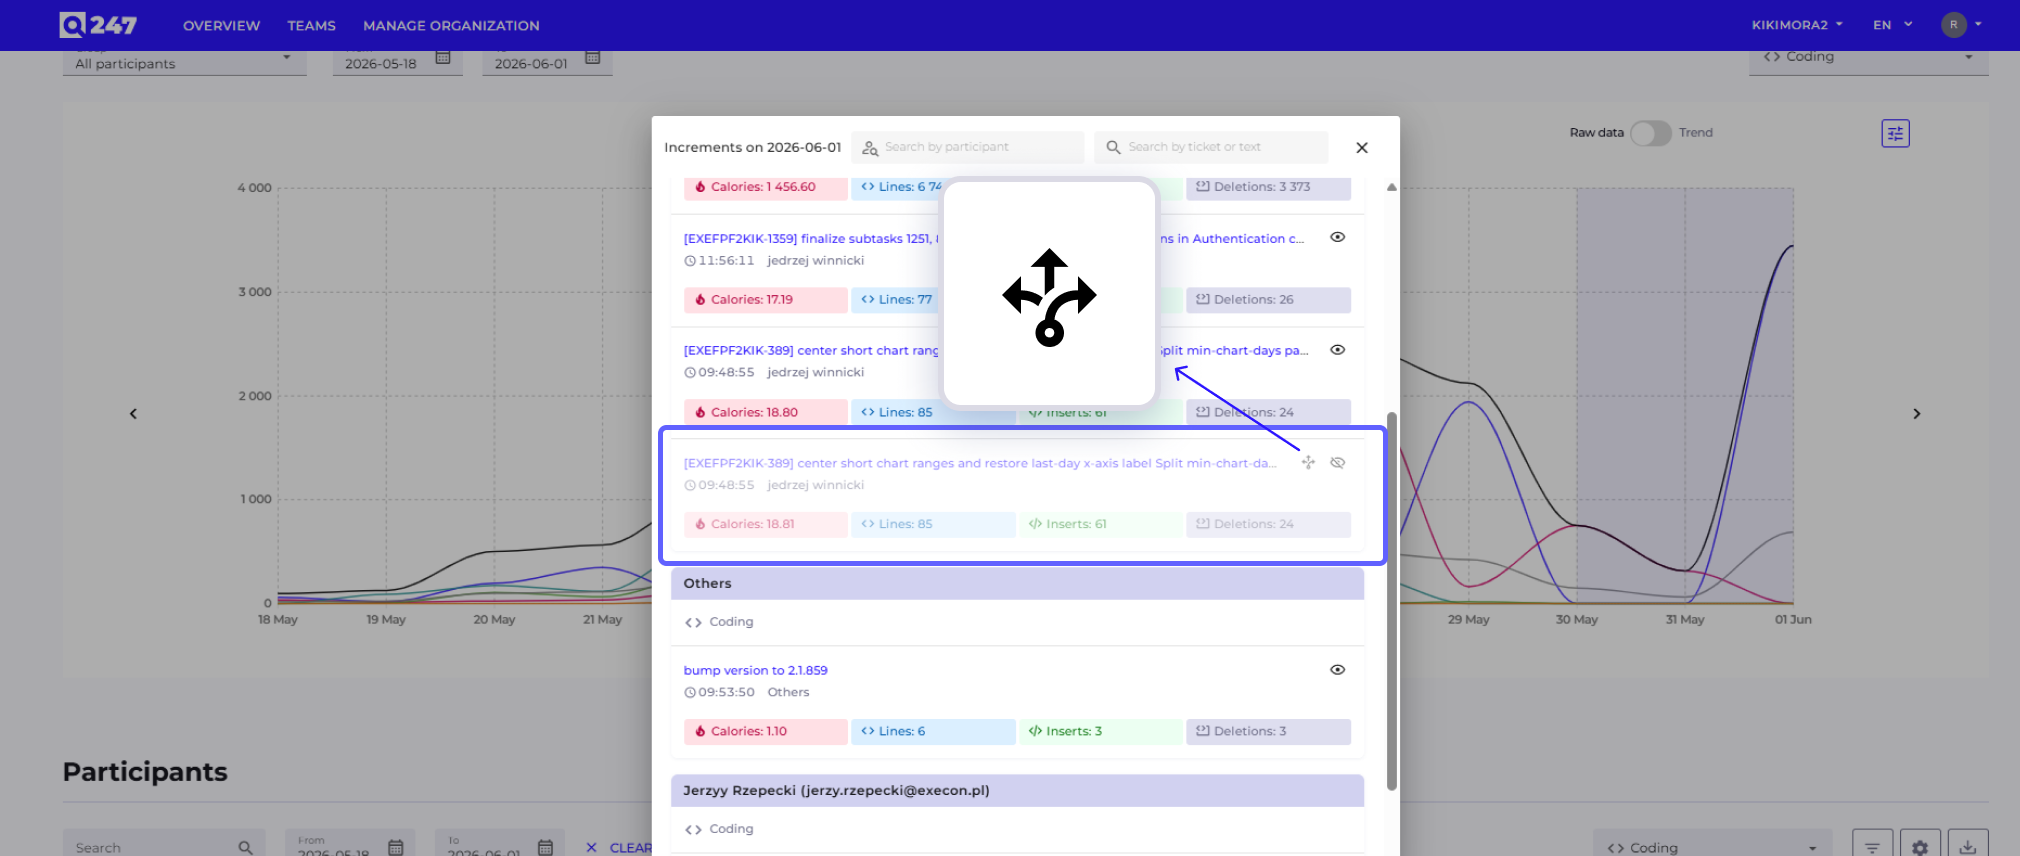
- Higher accuracy and consistency of analytical data — better cherry-pick detection (only the copy of a commit is marked, not the original) and immediate, consistent hiding of commits across all analytical views.
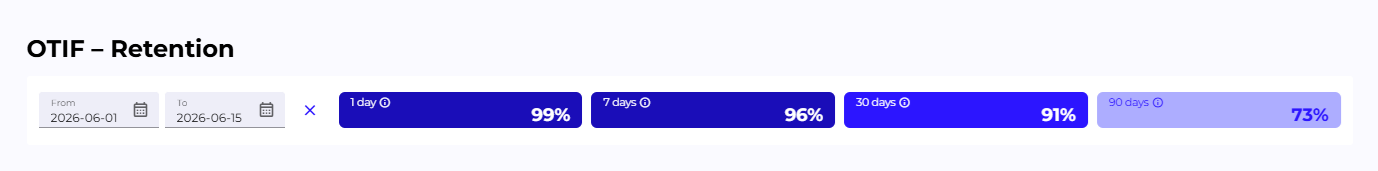
- Participant view and login improvements — a user without elevated permissions now sees their own OTIF component, the view preserves the "Total Metrics" selection after a refresh, dropdown lists open smoothly, and password recovery for SSO-login accounts shows a clear message.
- Interface polish and technology refresh — minor consistency fixes for tables, charts, and login screens, plus an update of the user interface libraries.